21 Allometry
21.1 What is allometry?
Allometry
is the study and measurement of relative growth. Why is relative growth important in
animal agriculture?
- Different breeds may have different shapes, and animal
shapes are determined by differences in relative growth.
- Relative growth of different body tissues (say, muscle, fat
and bone) determines the economic yield of a carcass.
- Relative growth helps explain the evolution and selective
breeding of our meat animals.
21.2 Graphical analysis
In the graphical analysis of
animal shape, pioneered by D'Arcy Thompson in 1917, rectangular
coordinates were used to analyze
and manipulate anatomical plan views. The coordinates were transformed
mathematically and the anatomical plan was stretched to its new shape,
thus
facilitating the perception of ontogenetic
and phylogenetic shape. Before
the advent of computer graphics, this technique was too
difficult for the routine analysis of body shape and, without a
computer, the
technique is largely subjective, since in most cases it is easier to
fit a
transformed cartesian grid to a drawing than vice versa. Thus, there is
a risk
of merely using the cartesian transformation to illustrate a
preconceived idea
of a shape change, as in the example below.
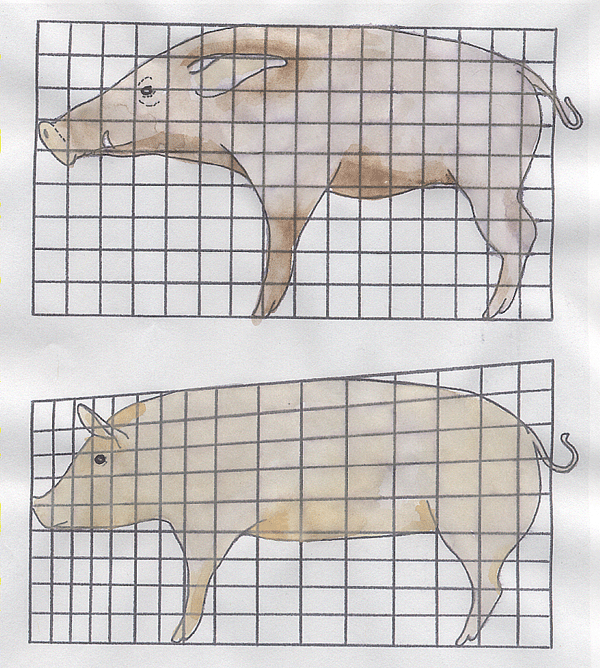
At the top is a wild boar who used to live in the London
Zoo, and underneath is a pig who used to live in Guelph. The
deformation of the grid shows how one picture is related to the other.
For example, the eye is roughly four squares across and two down. I
wonder which pig has more pork chops and ham?
In the 1950s, Sir John Hammond at the University of
Cambridge (one of the greatest of all animal scientists) simplified the
application
of this method of analysis by making photographic prints of animals at
magnifications giving a constant skull length. Lateral views of animals
at
constant skull length were superimposed onto graph paper grids to
demonstrate
the major changes in animal shape resulting from the domestication and
selective breeding of farm animals. Thus, when skull length was held
constant
photographically, the loins and hams of meat‑type pigs appeared to
balloon‑out
phlyogenetically from the diminutive rump of the wild boar. The same
technique
revealed a comparable inflation of the rear end as pigs grew from birth
to
slaughter weight.
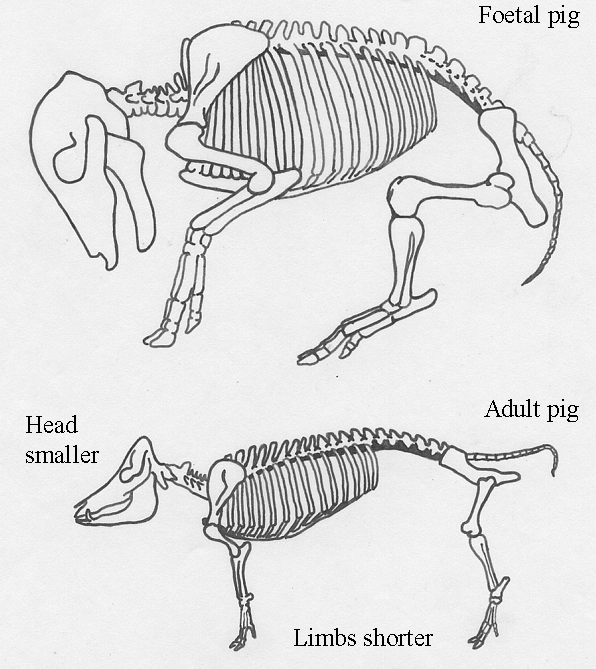
- At birth, meat animals tend to
have large heads and long slender limbs.
- Subsequent growth is marked by an
increase in body length and depth until, finally, the hams fill out
convexly.
- Hammond's method showed the animal shape most
likely to
yield the greatest mass of edible meat.
- BUT, unfortunately,
shape then became a more
important criterion than yield, despite the fact many
generations of
blocky meat animals failed to yield their promised return of lean meat
on the
butcher's block.
- The problem was subcutaneous and intermuscular
fat. To estimate meat yield in live animals we must visualize the
muscle mass beneath the animal's outward shape. Body regions where
subcutaneous
fat is scarce, and where muscle mass may be judged by the stance
between the
limbs are, therefore, particularly important in the judgement of live
meat
animals.
- As cattle grow fatter, fat deposition tends to shift
from relatively inexpensive cuts in the ventral part of the carcass to
the more
valuable cuts of the dorsal part of the carcass. This makes it
progressively more difficult to judge the amount of muscle in the
high-priced cuts.
- Thus, animal
scientists now look closely at the YIELD of meat we can sell from an
animal - more or less regardless of its shape. Shape is still very
important in traditional animal judging - but this is more of a beauty
contest than a scientific method for improving animals. But, there's
nothing wrong with beauty contests. Who wants to look out the
window at ugly animals?
21.3 Growth waves
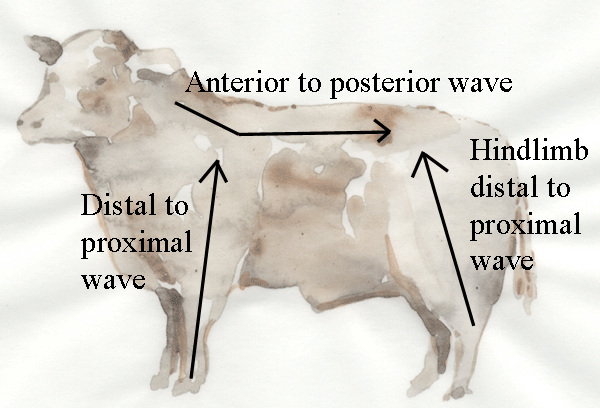
- Hammond's concept of
the ontogeny of shape in sheep
was a wave of growth starts from the head
and passes back along the vertebral column (anterior to posterior
wave).
- Secondary waves in the limbs pass
from distal to proximal.
- The union of the anterior to posterior wave in the
vertebral column, with the distal to proximal wave in the hindlimb
results in
the late, but extensive growth of the pelvic region.
- The major changes in
both ontogeny and phylogeny are a reduction in the head relative to
the body, and a
reduction in the limbs relative to the trunk of the body.
21.4 Huxley's allometric growth equation
Way back in 1932, Huxley
described
a simple mathematical method for the detection and measurement of the
allometric growth patterns revealed by D'Arcy Thompson's graphical
methods. To compare the relative
growth of two components (one of which may be the whole body), they are
plotted
logarithmically on X and Y axes,
y = bxk
so that
log y = log b + k log
x
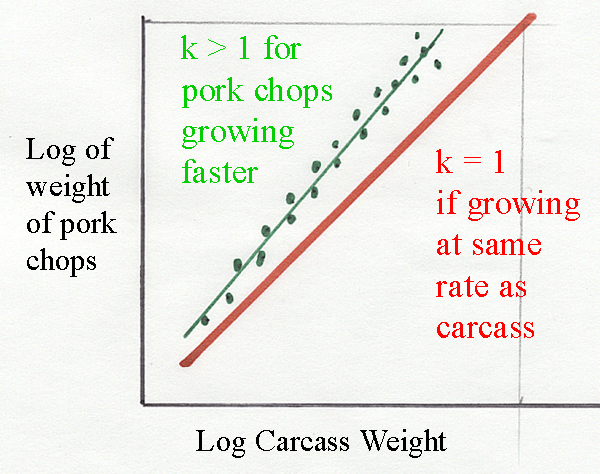
- The slope of the
resulting regression is called the allometric growth
ratio, often designated as k.
- With k = 1, both components are growing at the
same rate.
- With k < 1, the component represented on the Y axis is
growing
more slowly than the component on the X axis.
- With k > 1, the Y axis
component is growing faster than the X axis component.
Here are some allometric growth ratios from a study by
Berg and Butterfield (1976). Do not bother to
learn the numbers - just the pattern of high and low numbers.
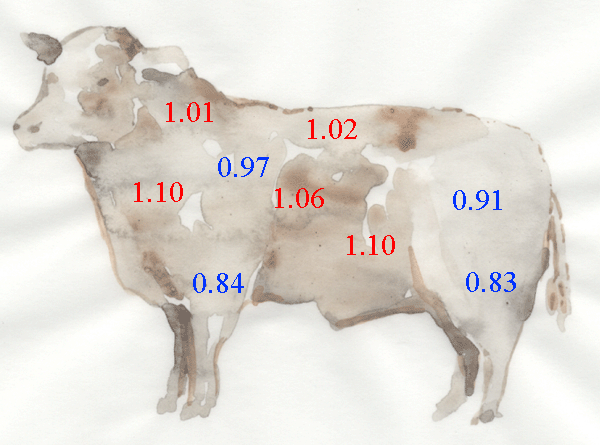
- The bad news is all those valuable steaks along the animal's
back only grow a little faster (k = 1.02) than the rest of the carcass.
- Throat muscles are growing much faster than the carcass,
probably because they act against the ligamentum nuchae which is
supporting the weight of the head. Remember, beef animals once used
their horns on the skull as an offensive weapon!
- More bad news, the abdominal muscles are also growing very
fast because they support the weight of the viscera plus the FAT they
are developing.
- Low allometric growth ratios in the distal limbs. This
is good news, because this is low grade meat for stewing.
- In cattle, muscle distribution
is influenced more by sex than by breed.
- Proximal hindlimb and abdominal
muscles are
heavier in heifers than in steers, and heavier in steers than in bulls.
The
order is reversed for muscles of the neck and thorax.
- In cattle, castration causes a marked decrease (up to
55%) in the growth of
shoulder muscles.
- Many carcass muscles may
acquire appreciable amounts of intramuscular fat in older animals. This
cannot
be removed by dissection and is, therefore, included in the muscle
weight.
Fortunately for carcass dissectors, growth gradients for intramuscular
fat in
different muscle groups are similar to those for the muscle.
- When expressed on the same basis (weight of
muscle plus bone), heifers are generally fatter than steers, and steers
are
fatter than bulls. These differences are related to the time of onset
of fat
deposition.
- Since the anatomical distribution of
muscle mass in different breeds of cattle is fairly constant, the
genetic
reduction of fat content probably provides the best means of selecting
for an
increased proportion of lean meat.
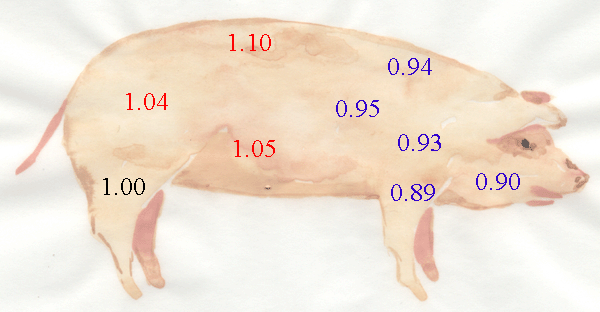
The
allometric growth ratios in pigs (above, from a study by Davies, 1974)
are more favourable. We have made more progress in improving meat yield
in pigs than we have with cattle. The ratios are high for the loin and
ham, and low for the less valuable cuts. The high ratio in the
belly is good news for bacon producers.
- Different species of poultry
show quite marked differences in their overall growth: ducks and geese
grow
rapidly at first, but only geese keep up the pace, whereas turkeys and
chickens
tend to have a slow start followed by a long period of a sustained
growth.
- Thus, allometric growth is quite conspicuous in the
muscles and bones of different species of poultry,
although not along the vertebral column as in mammals.
- In ducks,
the leg muscles are well developed at an early age, while the growth of
the
breast muscles is quite late.
- The same overall pattern of growth occurs in
chickens and in turkeys , but to a less extreme degree.
- This
pattern of muscle development is an obvious advantage to an animal
that, in the
wild state, would depend on its legs for early locomotion and only
later would
learn to fly.
- Poultry exhibit considerable variability in their body
proportions between breeds. Broad
Breasted Bronze turkeys, for example, may have shorter legs than other
smaller strains.
- At present, it is doubtful whether differences in
conformation have any relation to the relative distribution of the
muscle mass
and differences in nutrition do not appear to affect the distribution
of the
muscle mass in poultry.
<>In chickens and turkeys, the
early deposition of subcutaneous fat is a desireable trait, but in
ducks and
geese the reverse is true.
Genetic selection for live weight gain in poultry is difficult
to uncouple from increased fatness .
The heritabilities of
the weight and the proportion of the breast muscles are relatively high
in
ducks. But, because of the marked allometry of
muscle growth in ducks, selection for gain in the breast muscles may
not
improve the meat yield of the leg.
In summary, the
genetic
inflexibility of the allometric growth patterns of beef muscles
discourages any
attempt to change the distribution of muscles in the carcass. In
cattle, the
opposite tactic is more attractive, namely, selection against fatness
throughout
the carcass. In poultry, large allometric growth gradients extend along
the
breast‑leg axis, but we are not yet sure how they will respond to
genetic
selection. Perhaps leg muscle weights have a lower heritability than
breast
muscle weights because they are at the
low end of an allometric growth gradient?
21.5 Allometry and domestication
- CATTLE. The domestication of farm
animals several thousand years ago was accompanied by allometric
changes in
body shape and by an overall decrease in body size, but the
archeological record of animal domestication is difficult to interpret
because
traces of different species may overlap. In cattle, for example, the
bones of
the ancestral wild aurochs (Bos
primigenius) may give way to those of the
extinct shorthorn of the Iron Age (Bos
longifrons) and finally to the ancestors
of our present species (Bos taurus).
The bones of B. longifrons,
however, might
simply have been those of B.
primigenius cows. The frequency of occurrence of
bones may reflect the balance of hunting, containment and progressive
breeding
at any point in time. The identification of individual bones is
confounded by
the non‑random nature of specimens left by hunters, and by
technological
practices such as castration and the development of herds of cows.
Selection
may have encouraged the development of paedomorphic
forms with persistent
juvenile characteristics, such as pliable behavior, as well as neotenic forms
with precocious reproductive
development. Superimposed on these genetic changes
there may have been changes in body structure associated with the new
environment created by animal husbandry.
- BRAIN.
Domestication was associated
with considerable reductions in the weight of the brain; a 24%
reduction in
sheep , a 33% reduction in pigs and a
16% reduction in horses. The diminution of brain size relative
to body weight was accompanied by allometric changes between parts of
the
brain. In sheep, the cortical reduction of white matter exceeded that
of the
grey matter, and the parts of the brain involved with the senses of
smell, sight and hearing showed the greatest reduction, perhaps in
relation to
a safer environment and controlled feeding. Pigs reverted to a wild
state do not restore their original brain size, although
allometric changes may occur: feral pigs have a smaller cerebellum and
a larger
medulla oblongata.
- ENDOCRINE
GLANDS. Domestication is accompanied
by allometric changes in the endocrine glands. The relatively recent
derivation
of laboratory rats from wild Norway rats (Mus norvegicus) provides an
interesting model of events during the domestication of
farm animals. The dominant changes in rats were a reduction in the adrenal cortex
and an increase in the activity of
the gonads.
- DUCKS. In wild
and domesticated ducks, changes occur in the
pituitary‑adrenal
system.,
- SHEEP
provide a striking
example of phenotypic changes that may be produced by what Charles
Darwin
called unconscious selection. These changes include: (1) the ratio of
wool to
hair, (2) an increase in tail length or adiposity, (3) development of
the lop‑eared
condition, (4) increased convexity of the nose due to a decrease in jaw
length,
and (5) a reduction in the number and complexity of horns.
Further information
Structure and Development of Meat
Animals and Poultry. Pages 455-463.


