This LaTeX document is available as postscript or asAdobe PDF.
INTRODUCTION
After World Cup 1990, a proposal was submitted to FIFA for the statistical analysis of the scores of World Cup matches, which led to an obvious re-design of the World Cup format to make all games important. A copy of that proposal and revisions to it over the years is attached to this document.
The FIFA Coca-Cola World Rankings of 202 countries has been going on since 1993. After reading the description of the procedures that were used, the rankings could be made much more accurate by use of the methodology proposed in 1990. Some modifications to the method were needed in order to accommodate the factors included in the Coca-Cola Rankings.
The scores of matches from January 1, 1999 through to the present were retrieved from the FIFA website or tsn.ca, and scores from World Cup 1998 were included. Only the scores after regulation time were used. The proposed methodology was applied to the data and the results were presented at the beginning of this report.
DETAILS OF THE ANALYSIS
Firstly, it seemed inappropriate to use data for the last 8 years as in the Coca-Cola rankings, even if the older data are weighted less than more recent matches. Players on teams are constantly changing as well as the coaches. However, at least one year of matches is needed in order to obtain any kind of comparisons between teams. Therefore, only scores from matches played since January 1, 1999 were obtained. To this were added the matches of World Cup 1998. All scores were obtained from the FIFA A Matches website (except for World Cup 1998, which were already available) or from tsn.ca website.
The basis of the proposed method is a linear statistical model. The difference in goals scored by each team is the variable that is analyzed. Typically, the goal difference is 0, 1, 2, or 3 goals, but in some cases differences can be much larger, such as in the case of China PR versus Guam (19-0). Thus, the goal differences were restricted to be no greater than 9.
Countries were assigned to one of 9 regional groups on the basis of geography, which is similar to the 6 conferences in FIFA. Perhaps only 6 are needed, but 9 seemed logical. From this grouping it is possible to estimate the average goal differences between various pairs of groups, which is similar to a relative superiority of the different regions. These differences were estimated from the data, simultaneously with the differences for each country within a region. This is in contrast to the Coca-Cola Ranking which assigns regional strength factors on a seemingly arbitrary basis. Estimation from the data is much sounder from a scientific point of view.
The status of each match also had to be considered. World Cup matches and qualifiers were given a weight of 1, as were all Euro 2000 matches. Others were given a weight of 0.75, and Friendly matches were given a weight of 0.5. In addition, a match played in 1998 was given a weight of 0.8. Thus, a Friendly match from 1998 would have a weight of only 0.40 = 0.5*0.8.
There are differences between Home and Away games. However, not all Home matches have the same advantage. For example, some countries do more poorly at Home than other countries, probably due to the pressure that they are expected to win. Therefore, a Home team advantage was estimated separately for each country. For matches played on neutral territory, no home advantage was considered.
Formally, the linear statistical model can be described
as follows:
The equations that are solved are represented symbolically as
In order to rank the countries, the solutions for the region and the country's solution must be added together, i.e. Rh+Thi, because the Thi only estimates the superiority within a region. The results were all multiplied by 100 and rounded off to the nearest whole number.
RESULTS OF ANALYSIS
The solutions for the Rh effects and the definitions of the regions were in the first table of this report.
| Region | WTS | EGD | Definition |
| 1 | 108.0 | 147 | Scandinavia |
| 2 | 112.1 | -254 | S. Pacific |
| 3 | 79.1 | -68 | N. Am.- Carribean |
| 4 | 104.5 | -51 | N. Pacific |
| 5 | 256.2 | 128 | Europe |
| 6 | 81.8 | 141 | S. America |
| 7 | 203.8 | -55 | Middle East |
| 8 | 67.0 | -35 | Africa |
| 9 | 147.3 | 49 | Asia, Russia |
The column denoted as WTS is the sum of the weights placed on matches between two different regions. The column denoted as EGD is the estimated goal differential or superiority. To use these numbers, you have to subtract one region from another.
The next table gives the EGD for each country and the countries are ranked on that basis. Again, WTS indicates the sum of the weights of the matches played by that country. HOME indicates the home advantage for that country. REGION gives the region to which that country was assigned. Negative values indicate that a country would prefer to play games somewhere else. Not all countries had games played in their country, and so their value for HOME is 0. Not all countries played matches during the time period of matches included in this analysis, and those teams have been omitted from the listing. The rankings given here are quite different from the Coca-Cola Rankings, and this is due to the different method of analysis, fewer matches included in the analysis, allowance for different home team effects for each country, different regional groupings.
| Rank | Region | Country | WTS | EGD | Home |
| 1 | 5 | Netherlands | 23.2 | 270 | 11 |
| 2 | 6 | Argentina | 18.6 | 267 | 47 |
| 3 | 5 | France | 26.6 | 266 | 37 |
| 4 | 6 | Brazil | 25.7 | 259 | 52 |
| 5 | 5 | Italy | 24.1 | 238 | 29 |
| 6 | 5 | Portugal | 20.9 | 228 | 151 |
| 7 | 5 | Spain | 22.7 | 209 | 250 |
| 8 | 5 | Turkey | 18.4 | 202 | -87 |
| 9 | 6 | Uruguay | 12.8 | 200 | 45 |
| 10 | 5 | Ireland Republic | 17.8 | 200 | 14 |
| 11 | 5 | Belgium | 19.1 | 199 | 15 |
| 12 | 5 | England | 20.6 | 198 | 57 |
| 13 | 6 | Paraguay | 19.6 | 196 | 117 |
| 14 | 1 | Denmark | 24.9 | 193 | 3 |
| 15 | 1 | Sweden | 22.5 | 192 | 76 |
| 16 | 5 | Croatia | 21.0 | 185 | -3 |
| 17 | 5 | Yugoslavia | 21.7 | 185 | -25 |
| 18 | 1 | Norway | 26.0 | 182 | 0 |
| 19 | 5 | Czech Republic | 20.9 | 182 | 116 |
| 20 | 9 | Russia | 16.1 | 163 | 52 |
| 21 | 5 | Germany | 24.1 | 162 | 162 |
| 22 | 3 | Honduras | 24.5 | 161 | 107 |
| 23 | 4 | Japan | 20.5 | 158 | 59 |
| 24 | 5 | Poland | 18.2 | 155 | 56 |
| 25 | 5 | Romania | 26.6 | 149 | 40 |
| 26 | 6 | Peru | 16.4 | 145 | 8 |
| 27 | 5 | Scotland | 16.9 | 144 | -3 |
| 28 | 6 | Colombia | 20.7 | 144 | 50 |
| 29 | 1 | Iceland | 16.8 | 143 | 51 |
| 30 | 5 | Slovenia | 21.2 | 142 | -2 |
| 31 | 5 | Greece | 20.1 | 142 | -16 |
| 32 | 9 | Ukraine | 17.2 | 133 | 10 |
| 33 | 5 | Switzerland | 17.3 | 132 | 89 |
| 34 | 6 | Chile | 19.4 | 128 | 101 |
| 35 | 6 | Ecuador | 17.5 | 126 | 116 |
| Rank | Region | Country | WTS | EGD | Home |
| 36 | 5 | Bulgaria | 21.0 | 120 | 78 |
| 37 | 8 | Cameroon | 21.1 | 119 | -5 |
| 38 | 5 | Slovakia | 22.1 | 117 | 1 |
| 39 | 3 | United States | 24.5 | 117 | 132 |
| 40 | 3 | Mexico | 31.8 | 112 | 202 |
| 41 | 1 | Finland | 18.8 | 107 | 75 |
| 42 | 5 | Hungary | 16.3 | 104 | 50 |
| 43 | 7 | Iran | 24.2 | 101 | 100 |
| 44 | 5 | Wales | 12.6 | 97 | -35 |
| 45 | 5 | Northern Ireland | 14.3 | 96 | -76 |
| 46 | 6 | Guyana | 4.6 | 93 | -156 |
| 47 | 8 | Morocco | 22.7 | 91 | 13 |
| 48 | 5 | Bosnia-Herzegovina | 13.7 | 86 | 54 |
| 49 | 1 | Faroe Islands | 12.5 | 83 | -115 |
| 50 | 4 | China PR | 23.0 | 79 | 127 |
| 51 | 4 | Korea Republic | 23.4 | 79 | 107 |
| 52 | 3 | Cuba | 18.0 | 76 | 25 |
| 53 | 2 | Australia | 15.1 | 76 | 283 |
| 54 | 9 | Georgia | 16.0 | 73 | -28 |
| 55 | 8 | South Africa | 27.6 | 72 | 68 |
| 56 | 7 | Iraq | 19.8 | 70 | 309 |
| 57 | 5 | FYR Macedonia | 13.9 | 70 | 49 |
| 58 | 9 | Albania | 15.1 | 64 | 32 |
| 59 | 3 | Canada | 20.8 | 60 | 16 |
| 60 | 6 | Surinam | 7.8 | 60 | 73 |
| 61 | 8 | Cote d' Ivoire | 20.5 | 59 | 98 |
| 62 | 9 | Belarus | 15.1 | 58 | 82 |
| 63 | 7 | Egypt | 26.6 | 58 | 111 |
| 64 | 7 | Israel | 18.1 | 57 | 188 |
| 65 | 8 | Tunisia | 26.0 | 56 | 154 |
| 66 | 6 | Venezuela | 15.1 | 56 | -11 |
| 67 | 3 | St Lucia | 10.2 | 56 | -29 |
| 68 | 3 | Costa Rica | 19.9 | 55 | 181 |
| 69 | 7 | Saudi Arabia | 26.6 | 54 | 196 |
| 70 | 7 | Jordan | 23.8 | 54 | 14 |
| Rank | Region | Country | WTS | EGD | Home |
| 71 | 5 | Austria | 14.6 | 52 | 150 |
| 72 | 9 | Kazakhstan | 12.7 | 48 | 105 |
| 73 | 6 | Bolivia | 17.3 | 44 | 239 |
| 74 | 7 | Qatar | 21.1 | 43 | 39 |
| 75 | 9 | Armenia | 16.4 | 43 | 31 |
| 76 | 8 | Nigeria | 22.1 | 43 | 148 |
| 77 | 9 | Lithuania | 16.7 | 41 | -192 |
| 78 | 8 | Senegal | 27.6 | 39 | 99 |
| 79 | 8 | Zambia | 28.0 | 37 | 13 |
| 80 | 9 | Estonia | 20.2 | 34 | 4 |
| 81 | 7 | Lebanon | 19.4 | 24 | -23 |
| 82 | 7 | Tajikistan | 4.3 | 23 | -22 |
| 83 | 3 | Trinidad & Tobago | 26.6 | 20 | 222 |
| 84 | 9 | Latvia | 16.4 | 16 | -4 |
| 85 | 3 | Guatemala | 26.0 | 15 | 100 |
| 86 | 9 | Moldova | 15.7 | 12 | 58 |
| 87 | 8 | Zimbabwe | 21.0 | 11 | 95 |
| 88 | 7 | Turkmenistan | 10.3 | 11 | 0 |
| 89 | 8 | Algeria | 21.4 | 10 | 85 |
| 90 | 7 | Uzbekistan | 17.0 | 9 | 253 |
| 91 | 3 | Jamaica | 25.8 | 9 | 164 |
| 92 | 7 | United Arab Emirates | 19.5 | 8 | 67 |
| 93 | 2 | Fiji | 7.5 | 7 | 9 |
| 94 | 8 | Guinea | 15.7 | 4 | 118 |
| 95 | 8 | Ghana | 18.2 | 4 | 117 |
| 96 | 8 | Liberia | 17.3 | 0 | 172 |
| 97 | 8 | Togo | 21.3 | 0 | 68 |
| 98 | 3 | Bermuda | 6.7 | -8 | 144 |
| 99 | 8 | Chad | 5.7 | -9 | 39 |
| 100 | 7 | Bahrain | 15.1 | -10 | -35 |
| 101 | 8 | Burundi | 12.3 | -11 | -68 |
| 102 | 3 | El Salvador | 18.3 | -11 | 200 |
| 103 | 8 | Central African Rep | 5.7 | -12 | -67 |
| 104 | 7 | Syria | 20.3 | -13 | 214 |
| 105 | 8 | Burkina Faso | 23.8 | -13 | 103 |
| Rank | Region | Country | WTS | EGD | Home |
| 106 | 8 | Madagascar | 17.3 | -16 | 26 |
| 107 | 8 | Congo | 22.6 | -17 | 113 |
| 108 | 8 | Angola | 21.6 | -17 | 169 |
| 109 | 7 | Kuwait | 18.3 | -19 | 163 |
| 110 | 4 | Korea DPR | 7.3 | -21 | 0 |
| 111 | 8 | Malawi | 15.4 | -21 | -30 |
| 112 | 8 | Kenya | 19.0 | -22 | 32 |
| 113 | 5 | Luxemburg | 13.8 | -29 | 38 |
| 114 | 3 | Haiti | 21.1 | -30 | 246 |
| 115 | 3 | Grenada | 10.2 | -31 | -52 |
| 116 | 2 | New Zealand | 12.4 | -34 | 266 |
| 117 | 7 | Oman | 20.6 | -34 | 91 |
| 118 | 8 | Sudan | 15.0 | -35 | 141 |
| 119 | 3 | Barbados | 18.6 | -35 | 47 |
| 120 | 8 | Mali | 12.2 | -39 | 161 |
| 121 | 8 | Tanzania | 5.7 | -39 | 7 |
| 122 | 8 | Libya | 17.7 | -42 | 153 |
| 123 | 8 | Mauritius | 13.2 | -42 | 53 |
| 124 | 2 | Thailand | 27.7 | -43 | 79 |
| 125 | 3 | Panama | 16.9 | -45 | 208 |
| 126 | 8 | Lesotho | 17.3 | -45 | -23 |
| 127 | 8 | Rwanda | 10.6 | -46 | 86 |
| 128 | 8 | Gambia | 5.8 | -47 | 32 |
| 129 | 3 | St Kitts & Nevis | 8.9 | -48 | 176 |
| 130 | 8 | Mozambique | 10.9 | -48 | -30 |
| 131 | 5 | Andorra | 15.9 | -48 | -16 |
| 132 | 8 | Gabon | 21.1 | -51 | 137 |
| 133 | 8 | Malta | 17.4 | -53 | 37 |
| 134 | 8 | Ethiopia | 6.7 | -54 | 63 |
| 135 | 5 | Liechtenstein | 13.3 | -55 | -65 |
| 136 | 8 | Cape Verde Islands | 6.8 | -56 | 113 |
| 137 | 7 | Yemen | 9.6 | -57 | -21 |
| 138 | 8 | Botswana | 8.1 | -58 | 10 |
| 139 | 3 | Dominican Rep | 6.9 | -69 | 71 |
| 140 | 8 | Mauritania | 4.6 | -73 | -9 |
| Rank | Region | Country | WTS | EGD | Home |
| 141 | 8 | Equatorial Guinea | 5.7 | -73 | -93 |
| 142 | 8 | Congo DR | 20.1 | -73 | 194 |
| 143 | 8 | Guinea-Bissau | 3.2 | -74 | 73 |
| 144 | 8 | Uganda | 18.5 | -74 | 153 |
| 145 | 8 | Namibia | 22.5 | -75 | 151 |
| 146 | 8 | Sierra Leone | 10.7 | -76 | 148 |
| 147 | 7 | Cyprus | 16.1 | -80 | 172 |
| 148 | 7 | Palestine | 13.0 | -87 | 0 |
| 149 | 9 | Azerbaijan | 16.0 | -91 | 232 |
| 150 | 3 | St Vincent/Grenadines | 17.0 | -96 | 154 |
| 151 | 4 | Hong Kong | 13.3 | -100 | -10 |
| 152 | 3 | Cayman Islands | 7.8 | -104 | -21 |
| 153 | 3 | Nicaragua | 4.9 | -105 | 14 |
| 154 | 8 | Benin | 4.6 | -105 | 129 |
| 155 | 3 | Netherlands Antilles | 3.0 | -106 | 66 |
| 156 | 8 | Swaziland | 11.2 | -112 | 118 |
| 157 | 2 | Vietnam SR | 14.7 | -113 | 107 |
| 158 | 7 | India | 14.8 | -115 | 104 |
| 159 | 8 | Niger | 1.8 | -118 | 78 |
| 160 | 3 | Belize | 4.4 | -123 | -88 |
| 161 | 8 | Sao Tome e Principe | 5.7 | -123 | 160 |
| 162 | 2 | Indonesia | 17.6 | -124 | 251 |
| 163 | 3 | Antigua and Barbuda | 10.3 | -126 | 72 |
| 164 | 8 | Seychelles | 2.7 | -127 | 52 |
| 165 | 4 | Singapore | 17.8 | -132 | 35 |
| 166 | 7 | Kyrgyzstan | 10.7 | -136 | 0 |
| 167 | 3 | Dominica | 8.3 | -136 | -65 |
| 168 | 8 | Eritrea | 11.9 | -138 | 145 |
| 169 | 2 | Solomon Islands | 5.7 | -140 | 0 |
| 170 | 3 | Anguilla | 3.4 | -144 | -71 |
| 171 | 2 | Tahiti | 6.1 | -154 | 94 |
| 172 | 8 | Somalia | 4.4 | -155 | 0 |
| 173 | 2 | Malaysia | 24.3 | -155 | 119 |
| 174 | 3 | Puerto Rico | 4.4 | -169 | -34 |
| 175 | 7 | Bangladesh | 14.8 | -177 | 0 |
| Rank | Region | Country | WTS | EGD | Home |
| 176 | 2 | Vanuatu | 6.7 | -181 | 0 |
| 177 | 4 | Chinese Taipei | 11.8 | -183 | 0 |
| 178 | 7 | Myanmar | 6.6 | -187 | 0 |
| 179 | 5 | San Marino | 11.3 | -199 | 56 |
| 180 | 3 | British Virgin Is. | 9.0 | -199 | 74 |
| 181 | 8 | Djibouti | 5.3 | -204 | 130 |
| 182 | 3 | Aruba | 6.6 | -204 | 102 |
| 183 | 7 | Nepal | 12.3 | -211 | -59 |
| 184 | 3 | Montserrat | 3.8 | -218 | 0 |
| 185 | 7 | Maldives | 17.9 | -242 | 149 |
| 186 | 3 | Bahamas | 7.1 | -263 | 48 |
| 187 | 2 | Samoa | 6.7 | -274 | 0 |
| 188 | 3 | Turks and Caicos Islands | 3.5 | -291 | 0 |
| 189 | 4 | Macao | 9.1 | -297 | 96 |
| 190 | 7 | Mongolia | 9.1 | -298 | 0 |
| 191 | 2 | Sri Lanka | 15.9 | -308 | 71 |
| 192 | 2 | Brunei Darussalam | 10.3 | -331 | -154 |
| 193 | 2 | Cambodia | 13.7 | -337 | 18 |
| 194 | 2 | Papua New Guinea | 2.0 | -344 | 0 |
| 195 | 7 | Pakistan | 11.2 | -353 | 0 |
| 196 | 3 | US Virgin Is. | 6.4 | -372 | -71 |
| 197 | 2 | Philippines | 12.2 | -387 | -118 |
| 198 | 2 | Tonga | 6.7 | -401 | 0 |
| 199 | 2 | Cook Islands | 6.1 | -453 | 0 |
| 200 | 2 | Laos | 12.1 | -506 | 319 |
| 201 | 2 | Guam | 4.5 | -547 | 0 |
| 202 | 2 | American Samoa | 6.7 | -616 | 0 |
COMMENTS
The purpose of this document was to show that the data could be analyzed in a very different manner from the Coca-Cola Ranking procedure. The methods here could be modified if they do not agree with some people. For example, data from 8 years could be analyzed by the same procedures; the weightings on different types of matches could be varied; the limit of 9 goal differences could be increased or decreased; an overall home team effect could be imposed rather than separate effects for each country, but this would be incorrect to do; regional groupings could be made differently (Africa could be split into two or three groups on some basis). There should be a minimum of probably 10 countries per region, unless 10 countries can not be found suitable.
The rankings should be used to select the teams that go forward to the World Cup within each of the 6 conferences or overall. The format of the World Cup games could be improved as indicated in the 1990 proposal. During the World Cup, the matches played should be analyzed separately from all other data, so the rankings based on World Cup play only are used in seeding teams for the second round of play.
Statistically, the methods presented here have advantages over the Coca-Cola Ranking procedure, as a more accurate assessment of countries. The biggest advantage is that the data are used to determine the best adjustments for home team effects and regional differences, rather than guessing what those adjustments should be. My recommendation is to adopt the methods given here in place of the Coca-Cola Ranking or as an improvement to the Coca-Cola Ranking.
INTRODUCTION
West Germany won the 1990 World Cup of Soccer by defeating Argentina in a re-match of the 1986 World Cup final. There are those who would have preferred to see Italy versus West Germany in the final, but Italy was eliminated by Argentina in a penalty kick shoot-out. West Germany needed penalty kicks to decide their match against England as well. There seemed to be a disproportionate number of matches determined by the shoot-out format, and the seemingly unfair results from them has sparked criticism of the format for the World Cup competition.
This paper proposes an alternative overall format that could be utilized. The proposal looks at the problem as a problem in statistical design of an experiment. The objective of this particular experiment is to correctly rank the participating teams for selecting the best teams for the first and second rounds of World Cup play.
PREPARATORY MATCHES
Starting with 200 or more countries that are attempting to make the field of 24 teams that will compete in the 1994 World Cup, the current format is to define 6 regional areas and the teams that should compete against each other within that regional area. The number of teams within each area is not equal. The distance that teams must travel to play the other teams is minimized, and therefore the costs, but statistically this is not an ideal design because comparisons of teams from different regions is not possible. (The Coca Cola Rankings now make it possible).
Statistically, each team should play as many different opponents as economically possbile, from as many different regions as possible. To limit the costs of travel, four teams could travel to one location and over a period of one week play each of the other three teams. For example, in 1986 Canada was in a region with only 2 or 3 other teams, and Canada had to play each of these teams at least twice, once in Canada and once in the other country. This was not terribly exciting for Canadian soccer fans. Much more interest would have been generated if Canada had played England, Italy, the USA, or Cameroon, for example. Even if Canada lost all of these games, the contribution of these matches to the overall interest in soccer in Canada would have been significant. England would have been able to play the other teams while they were in Canada. Canada could travel to France, for example, to play France, the Netherlands, Saudi Arabia, and Poland perhaps. The results of these many different cross exchanges would be a set of scores which could be analyzed by a linear statistical model thereby providing an accurate ranking of all 100+ teams. The analysis of these scores can be done in seconds by computer. (See Harville 1977 "The use of linear model methodology to rate high school or college football teams", Journal of the American Statistical Association 72:278). (Note: In 2000, there are now enough connections between teams to make an analysis feasible - all countries are connected).
SELECTING 24 TEAMS
After all the preparatory games have been played, then the scores would be analyzed by an appropriate statistical linear model. Each team receives a number indicating the estimated goal difference(EGD) between them and an average team out of the 100+ teams. For example, Italy might have an EGD of +1.4 and Canada might be -2.9, and therefore, if Italy were to play Canada, then Italy would be expected to outscore Canada by 4.3 goals. All teams could be ranked on the basis of their EGDs, and the top 24 teams would be chosen for the World Cup finals. On this basis, some of the 24 regions may not have any representation in the final, but the best 24 teams in the world would be in the finals. If each region had to be represented, then the teams with the best EGD in each region could be selected, but these would not necessarily be the best 24 teams in the world.
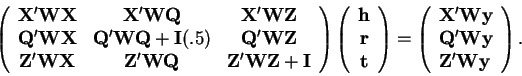
THE MODEL
Let

| Team i | Team j | Score i | - | Score j | = | Difference |
| AA | BB | 3 | - | 2 | = | 1 |
| CC | DD | 2 | - | 2 | = | 0 |
| AA | CC | 1 | - | 1 | = | 0 |
| DD | EE | 0 | - | 1 | = | -1 |
| BB | CC | 0 | - | 1 | = | -1 |
| AA | DD | 0 | - | 1 | = | -1 |
| CC | EE | 1 | - | 0 | = | 1 |
| BB | AA | 0 | - | 2 | = | -2 |
| DD | FF | 1 | - | 0 | = | 1 |
| CC | BB | 3 | - | 0 | = | 3 |
| DD | AA | 2 | - | 1 | = | 1 |
| BB | EE | 2 | - | 2 | = | 0 |
The won-lost records of the six teams is shown in the next table.
| Team | Won | Tied | Lost |
| CC | 3 | 2 | 0 |
| DD | 3 | 1 | 1 |
| AA | 2 | 1 | 2 |
| EE | 1 | 1 | 1 |
| BB | 0 | 1 | 4 |
| FF | 0 | 0 | 1 |
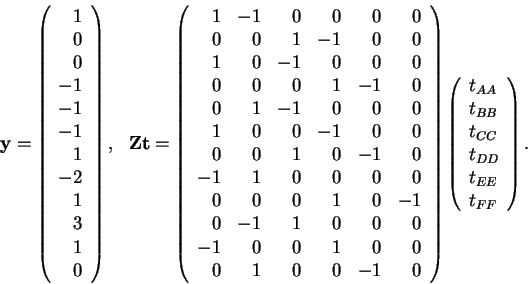
Note that teams have not played the same number of games each, nor have
they played each other an equal number of times. There were a total
of 12 games played. The vector ![]() is the last column of
the first table of order 12 by 1. The vector
is the last column of
the first table of order 12 by 1. The vector ![]() is a vector
of order 6 by 1 (for the six teams), and the matrix
is a vector
of order 6 by 1 (for the six teams), and the matrix ![]() is
shown below:
is
shown below:
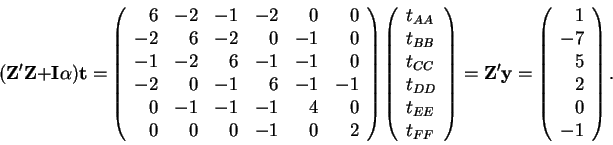
| Team | Won | Tied | Lost | EGD |
| CC | 3 | 2 | 0 | .62 |
| DD | 3 | 1 | 1 | .43 |
| AA | 2 | 1 | 2 | .10 |
| EE | 1 | 1 | 1 | .03 |
| BB | 0 | 1 | 4 | -.92 |
| FF | 0 | 0 | 1 | -.28 |
If team AA were to play team FF, then AA would be expected to win by .38 of a goal. There are standard errors around these estimates, of course. The standard error for this prediction is .74, and thus, there is not very much difference from 0. So the outcome would be expected to be even for either side. In order to reduce the standard errors, teams need to play more games and with as many different opponents as possible.
THE FORMAT OF PLAY FOR THE BEST 24
Having determined the 24 best teams in the world, then World Cup play begins. The current procedure is to have a drawing to put the teams into 6 groups of 4 teams each. Then teams play each other within a group. The top 2 teams in each group plus four teams with the best records after that advance to the elimination round. This practice is statistically unsound because there are no games between groups. Suppose the best 4 teams in the world are assigned to the same group, then only two of those teams are guaranteed of advancing to the elimination round.
A better statistical approach would be to make two lists of twelve teams as shown in the table below. List A might be the 12 teams fromt he preparatory rounds with the highest EGD values, and List B would be the next 12 teams, not in any particular order.
| List A | List B |
| Germany | UAE |
| South Korea | Czech Republic |
| Italy | Sweden |
| Argentina | USA |
| Belgium | Scotland |
| Spain | Costa Rica |
| England | Uruguay |
| Romania | Egypt |
| Yugoslavia | Cameroon |
| Russia | Austria |
| Netherlands | Colombia |
| Brazil | Ireland |
The teams would play each other as listed. Then the team at the top of List B (UAE) would move to the bottom of List B and the other teams would shift up one spot. This could happen 2-4 times depending on the number of games desired in the first round. Suppose each team plays four games, then the schedule would be as shown in the next table.
| List A | List B | Shift 1 | Shift 2 | Shift 3 |
| Germany | UAE | Czech Republic | Sweden | USA |
| South Korea | Czech Republic | Sweden | USA | Scotland |
| Italy | Sweden | USA | Scotland | Costa Rica |
| Argentina | USA | Scotland | Costa Rica | Uruguay |
| Belgium | Scotland | Costa Rica | Uruguay | Egypt |
| Spain | Costa Rica | Uruguay | Egypt | Cameroon |
| England | Uruguay | Egypt | Cameroon | Austria |
| Romania | Egypt | Cameroon | Austria | Colombia |
| Yugoslavia | Cameroon | Austria | Colombia | Ireland |
| Russia | Austria | Colombia | Ireland | UAE |
| Netherlands | Colombia | Ireland | UAE | Czech Republic |
| Brazil | Ireland | UAE | Czech Republic | Sweden |
The games from the preparatory rounds are discarded now, and the scores of the first round games would be analyzed by the proposed model and the EGD are used to rank the teams at the end of first round play. Analyses could be run after every game played so that teams that definitely make the next round can be identified as soon as possible, but the matchups in the second round can only be determined after all games in the first round have been completed. The best 16 advance to the elimination round and are seeded according to their EGD values, much like tennis players in tournament play. With this type of system each team is not really allowed to relax in any of the games. Every goal is important.
The advantage of this design is that there are good comparisons among all teams. Note, for example, that Spain plays Costa Rica, Uruguay, Egypt, and Cameroon. However, Costa Rica also plays Belgium, Argentina, and Italy, and therefore, comparisons of Spain to Belgium, Argentina, and Italy are possible through Costa Rica and also through Uruguay and Egypt. All teams can be compared very reliably from this design. The top 16 teams can be determined very accurately, and this would make the elimination round much more enjoyable.
Because EGD are available on all teams, it should be possible to abandon the shoot-out at the end of tie games during the second round. The new rule would be that if a game ends in a tie, then the team with the higher EGD automatically advances. The lower team has to score one more goal than the higher team during regulation playing time. The lower team knows that it has to win to advance, and the higher team knows it only has to tie. This may not be fair, and so the shoot-out might still be necessary, but that is usually not fair either.
RESULTS FROM WORLD CUP 1990
All of the games from World Cup 1990 were analyzed by the proposed model. Only the outcome after 90 minutes of play was analyzed, and therefore, the result after the shoot-out was ignored. There were 24 teams and 52 total games. The top 8 teams are shown in the following table. West Germany played Argentina in the final, but obviously Italy and Czechoslovakia had much higher EGD than Argentina.
| Rank | Team | EGD |
| 1 | West Germany | 1.33 |
| 2 | Italy | 1.08 |
| 3 | Czechoslovakia | .99 |
| 4 | Argentina | .54 |
| 5 | Belgium | .45 |
| 6 | Spain | .43 |
| 7 | England | .38 |
| 8 | Romania | .37 |
RESULTS FROM WORLD CUP 1994
The scores of the first round of play, involving 24 teams, were analyzed by the proposed model. Based on their EGD (in parentheses), they were seeded to play the following schedule during the elimination round. These EGD are not as accurate as they could be because they are based on the design where cross group play does not take place. Better accuracy would occur from the format proposed in this report.
| 1 Argentina (1.27) | ||||
| 16 Bulgaria (-.07) | --- | |||
| --- | ||||
| 8 Switzerland (.20) | ||||
| 9 Netherlands (.13) | --- | |||
| --- | ||||
| 5 Germany (.40) | ||||
| 12 Mexico (.00) | --- | |||
| --- | ||||
| 4 Belgium (.53) | ||||
| 13 Norway (.00) | --- | |||
| -- | ||||
| 2 Brazil (1.20) | ||||
| 15 USA (.00) | --- | |||
| --- | ||||
| 7 Sweden (.20) | ||||
| 10 Romania (.00) | --- | |||
| --- | ||||
| 6 Spain (.40) | ||||
| 11 Italy (.00) | --- | |||
| --- | ||||
| 3 Nigeria (1.07) | ||||
| 14 Ireland (.00) | --- |
RESULTS FROM WORLD CUP 1998
In France, the number of teams was expanded to 32 for the first round of play, but only 16 advanced to the elimination round. France defeated Brazil in the final. The EGD had France ahead after the first round of play. Below are the top 8 teams after analyzing all games played (only the first 90 minutes of play).
| Rank | Team | EGD |
| 1 | France | 1.98 |
| 2 | Argentina | 1.27 |
| 3 | Croatia | 1.20 |
| 4 | Netherlands | 1.00 |
| 5 | Italy | .97 |
| 6 | Brazil | .84 |
| 7 | England | .76 |
| 8 | Spain | .57 |
According to the EGD, France and Argentina should have played each other in the final.
EURO 2000
Only 16 teams have played in the European Cup 2000 games. Based on the first round of play (4 groups of 4 teams, round robin within group play), the top 8 teams and how they should have been seeded is shown below. The EGD picked the same 8 teams to be in the elimination round as actually made it.
| 1 Netherlands (1.0) | |||
| 8 Yugoslavia (.0) | --- | ||
| --- | |||
| 4 France (.6) | |||
| 5 Spain (.2) | --- | ||
| --- | |||
| 3 Italy (.8) | |||
| 6 Turkey (.2) | --- | ||
| --- | |||
| 2 Portugal (1.0) | |||
| 7 Romania (.0) | --- |
This match-up is almost identical to that actually played. Turkey and Romania switched opponents, and based on the standard errors, this would be acceptable. However, Italy and Turkey played during the first round of play, and the format kept them from playing again in the elimination round. Both Turkey and Romania were eliminated in the second round. There could be special considerations in seeding teams to avoid two teams playing each other for a second time, but if the first round of play is designed also on a seeding basis, then double meetings should be less of a problem.
CONCLUSIONS
The first round of play should be designed so that each team plays four games, and using the staggered schedule given in an earlier table. The 32 teams should be seeded for the first round of play on the basis of their EGD from preliminary round games or some other measure of international rankings. The List A teams would be the pre-cup top 16 favorites, and List B would be the other 16 teams in any order. List B would then be staggered for the four games. This design would allow for an accurate assessment of the EGD of each team. Based on these EGD, then the top 16 teams can be seeded for the elimination round. Teams from List B could make the top 16 if one or more of the favourite teams do not perform well in the first round. The resulting games should be very exciting for the fans, and if teams play according to their EGD, then the final game should see the top two teams play against each other.
Tie games could still be determined by shoot-outs, or by a flip of the coin, or based on the higher EGD. No matter how it is done, it will not be totally fair. Preferably, it should be decided by the fans (a random sample) based on how they thought the two teams played in the game. The team with the most ball possession time or the most shots on goal could be chosen.
The time for the soccer world to advance into the millenium is now. It is time for FIFA to embrace the better design approach and the use of statistical methods to rank teams during first round play. After monitoring 3 World Cup events and two EuroCup events, the EGD method and design would not be any worse than the current format, and could potentially yield a much more interesting World Cup to the fans.
This LaTeX document is available as postscript or asAdobe PDF.
Larry Schaeffer